Posts

Genetic Algorithm for Centroid Selection on Kmeans Image Segmentation

Image
The K-means clustering algorithm has wide applications for data and document-mining, digital image processing and different engineering fields. In addition to that, the clustering algorithm is composed of simple algorithm steps and has fast convergence, however it is suffered by initial centroid selection while clustering an image. The initial centroid selection determines the clustering algorithm consistent results and performance. The good initial cluster-centroids lead to good clustering results, otherwise the bad initial cluster-centroids selection lead to bad results. In order to achieve K-means clustering's consistent result and performance, we propose initial cluster centroids selection by Genetic optimization algorithm. The GA (genetics algorithm) has efficient search operations (selection, crossover and mutation) for determination of global minima on selection of cluster centroid problems GA - population A set of solutions or chromosomes are called

Adaptive Median Filter for Image Corrupted by Salt and Pepper Noise

Image
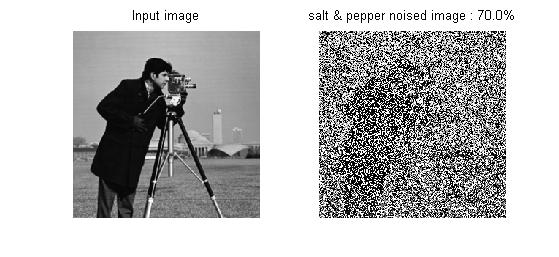
The image denoising is a preprocessing step in image processing and is used to recover the image which is corrupted by noise. It shown below the image corrupted by impulsive noise or salt and pepper noise is denoised by Adaptive Median filter. Impulsive noise is added to an image when the image is transmitted over a noisy channel and decoding error on the receiver side. It is modelled by imnoise function in Matlab programming. Median filter with small fixed window size is a preferred technique for denoising an image corrupted by salt & pepper noise because of simple and efficient. However, it is performance decreased the image corrupted by high density noise pixels. Adaptive Median filter changing it's window size depends on density of noise is a preferred technique for denoising an image corrupted by high density salt & pepper noise. Original Image and 70% salt & pepper noised image Denoised image by Adaptive median

Colour Image Contrast Enhancement by Histogram Equalization

Image
A colour image Enhancement by the histogram equalization process is as same as a grayscale image enhancement by histogram equalization except that colour space conversion technique included. The input colour image has R (Red),G (Green) and B (Blue) components which forms rectangular or cube coordinate colour space. When doing histogram equalization on the input image, It has to apply histogram equalization to each components RGB colour space consequently, the enhanced image object's original colour will vary. The HSV colour space has H (Hue),S (Saturation) and V (Value) components which forms circular or spherical coordinate colour space. When doing histogram equalization on the HSV colour space, It has to apply histogram equalization to only V component of HSV colour space and the resultant enhanced image object's original colour is preserved. Test Image 1 - dining table Test Image 1 - Histogram of original and Enhanced image

Image Segmentation - K-means Clustering

Image
Introduction to K-means clustering-algorithm The K-means clustering algorithm comprised of three steps, they distance, minimum-distance cluster assignment and cluster centroid update. These three steps are repeatedly executed until convergence meet or number of iteration end. The K-means algorithm splits the given dataset (image) into K number of clusters or groups It assigns a member(pixel) into a cluster (group) based on minimum distance between the pixel and all cluster centroids The algorithm is not complex and iterative procedure steps The high speed convergence but stayed on local minimum at most of times Unsupervised Clustering The K-means algorithm has no training phase. The dataset (image pixels) to be clustered is not attached with class or target variables. Assumed K number of C

Image Contrast Enhancement by Histogram Equalization

Image
A contrast enhancement of images by histogram equalization (HE) is very popular image processing technique widely used as preprocessing steps for medical and many other image and video processing applications. HE performs its operation by remapping the gray levels of the image based on the cumulative probability distribution of the input gray levels Test image 1 : butterfly Algorithm steps Histogram Equalization set maxI=255, minI=0 set nbins =255 Read Input-Image, im hc <- histogram-count (im,nbins) prob <- (hc) / sum(hc) cprob <- cumlative-sum(prob) Tf <- minI + (maxI -minI) x cprob Eim = Tf(im) maxI - maximum intensity level , minI - maximum intensity level nbins - number of bins(level) for histograms count Tf - Intensity mapping transfer function im - Input Image Eim - Enhanced output Image Matlab code for